Guide 3B Data Analysis
Products
Quiz, Media, & Portfolio Directions
Review Data Analysis Contents
Data Analysis Objectives
Managing Data
Describe the role and processes of data analysis, including errors in early interpretations of inheritance; and explain a monohybrid (one-trait cross), including the characteristics of the parents and offspring in the F1 and F2 generations.
Mendel
Explain Mendel’s principles of inheritance, including examples of these principles expressed in organisms; use a Punnett Square to predict the genotypes and phenotypes of offspring produced from parental crosses; and apply the Punnett Square technique to studying rat characteristics.
Cleaning & Homemaking
Analyze data on cleaning behaviors, determining the impact on animal survival; provide examples of animal homes, including their construction, architecture, and impacts on animal survival; and list characteristics of beavers, including their structures, behaviors, and role as a keystone species that impacts ecosystems.
Arthropods
List the characteristics of animals in Phylum Arthropoda; and provide examples of crustacean, insect, and arachnid arthropods.
Data Analysis Quiz
Data Analysis Media
Introduced in Managing Data section of this guide:
Population Data
In this media assignment you are collecting and submitting photographic and written data based on the plan you submitted for media piece 3A.
You are collecting data to answer:
-
What is the population size?
-
How is the population distributed?
-
Is there evidence of interactions within the population and/or interactions of the population with other species?
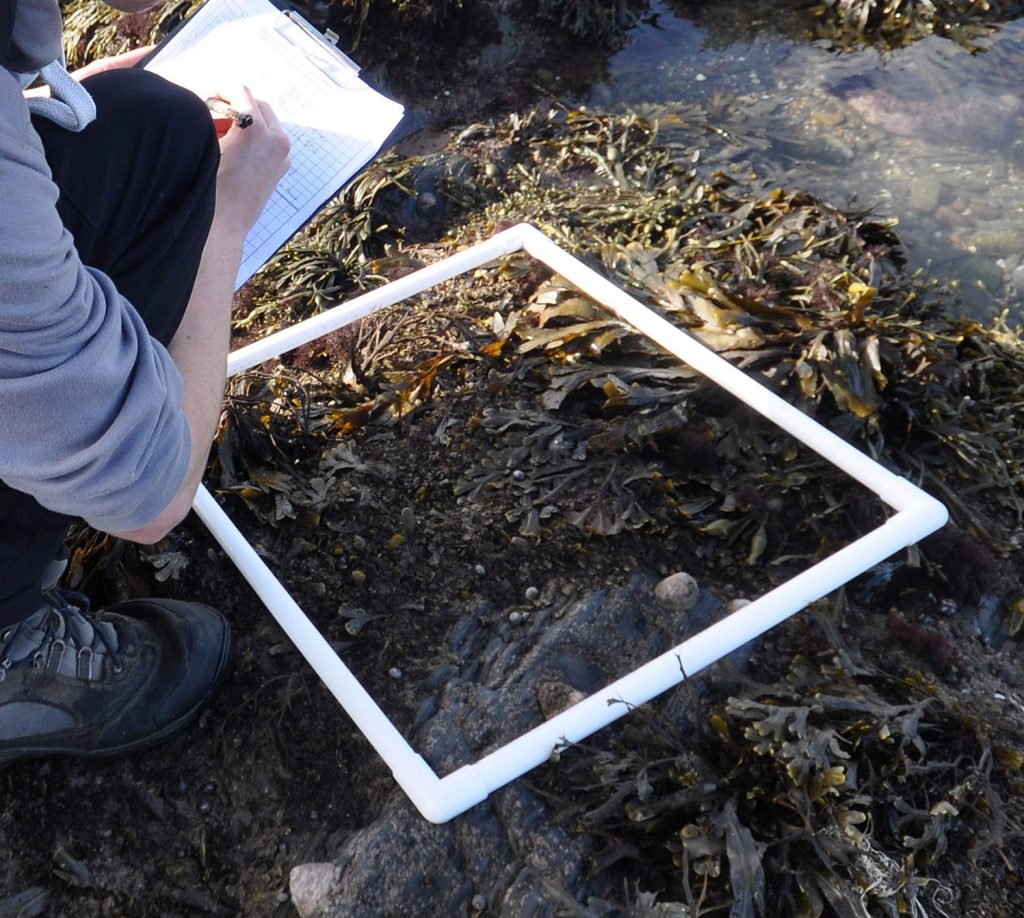
Construct and use a quadrat to sample a portion of the larger space. The quadrat could be string, rulers, pencils, etc. Just keep track of the size of the quadrat.
Collect data on the organisms in the quadrat, then move the quadrat to another area and repeat. The data can include: number or organisms, their distribution, and which other organisms they are interacting with.
Turn in photographs and writing about your results, including:
1. Photographs: ground-level view, eye-level view, and overhead view (if applicable)
2. Writing: researcher name(s), project name, location, weather, date, time, the number in the sample quadrat, the extrapolated number in the entire location, distribution, and interactions.


