
Genetic Technologies Accelerating Beyond Artificial Selection


Genetic Technologies Objectives
-
Match different forms of visualization with the information that is being conveyed.
-
Diagram the steps involved in cutting, copying, and moving pieces of DNA.

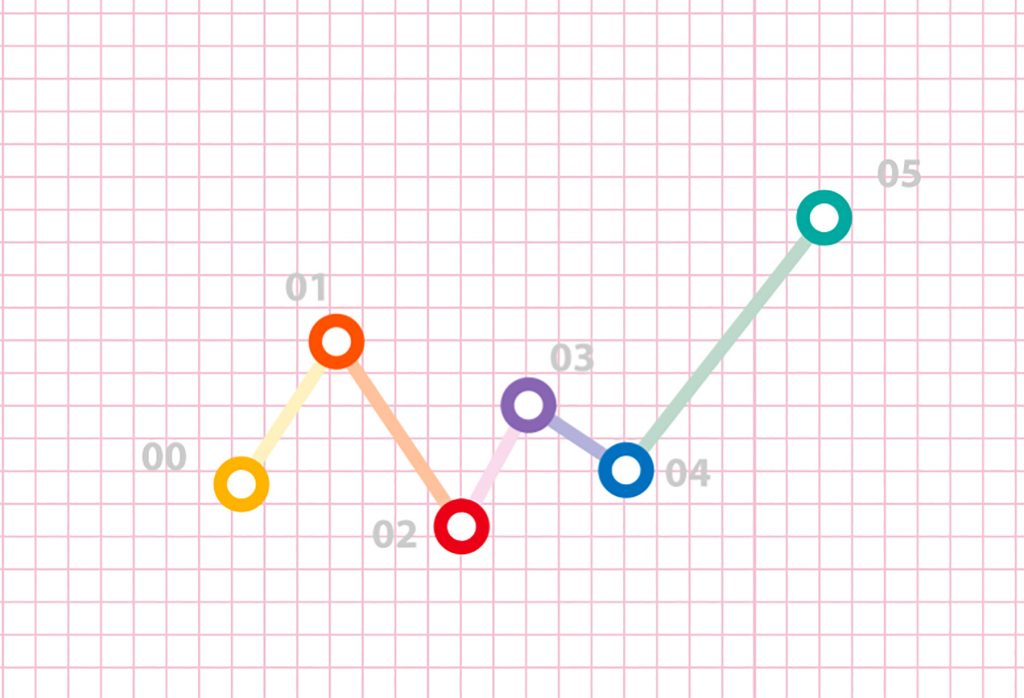
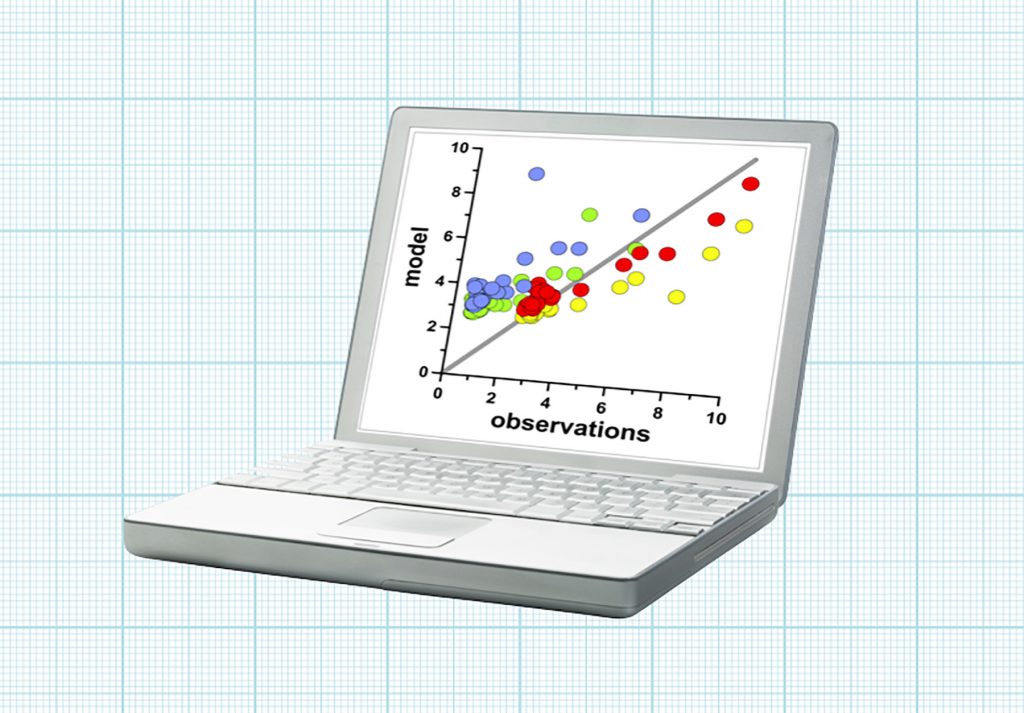
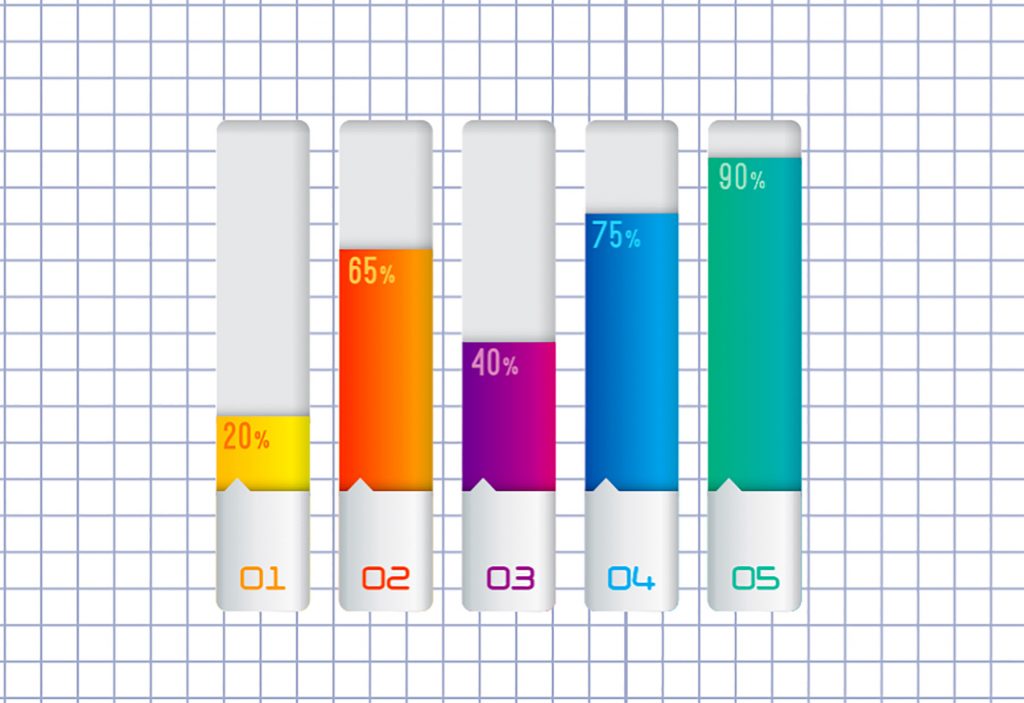
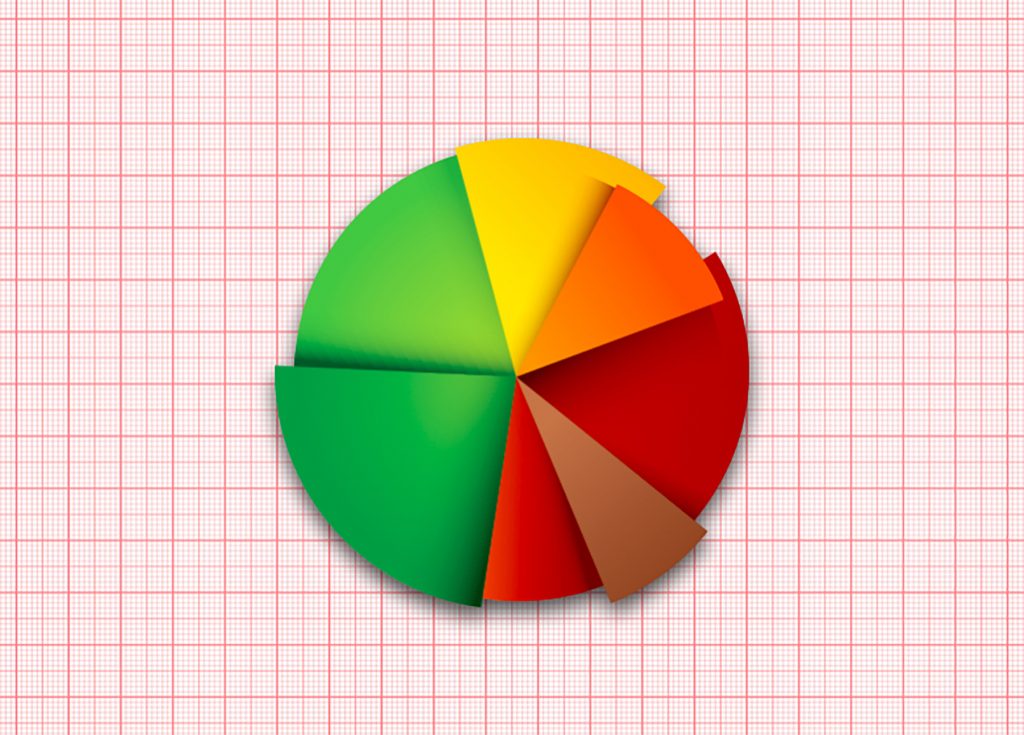
Data visualization is the use of graphs, plots, infographics, and other figures to visually represent data.
Data visualization starts with a choice: selecting the correct format to represent the data accurately.

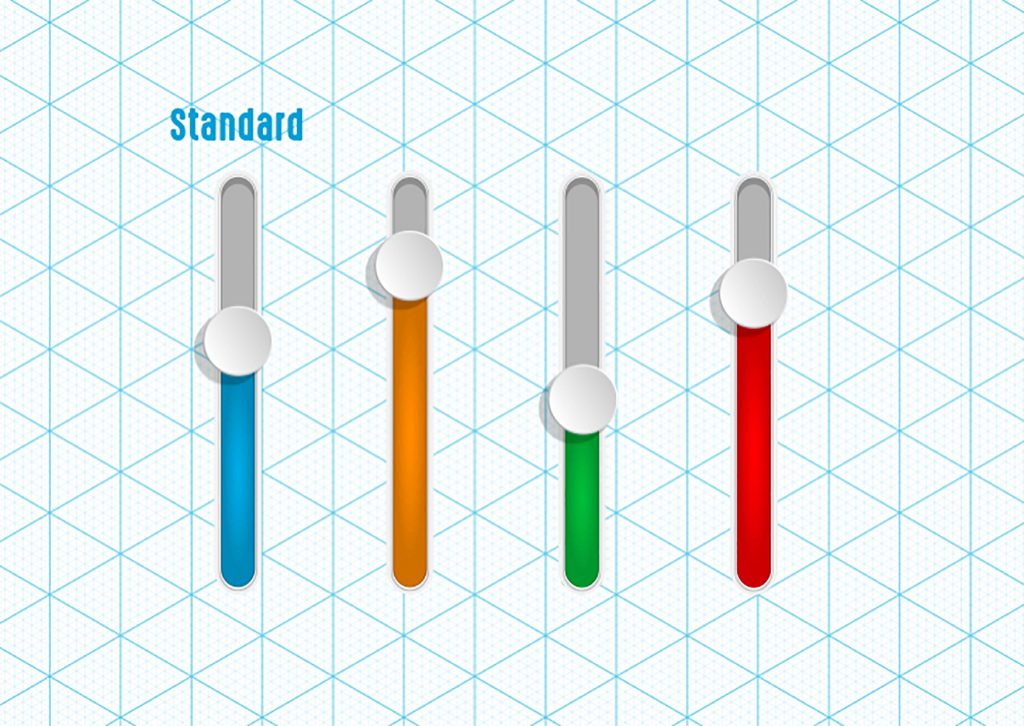
Advance through this slider to review eight common forms of data visualization, and what they represent.
Hover over the images to pause the scroll

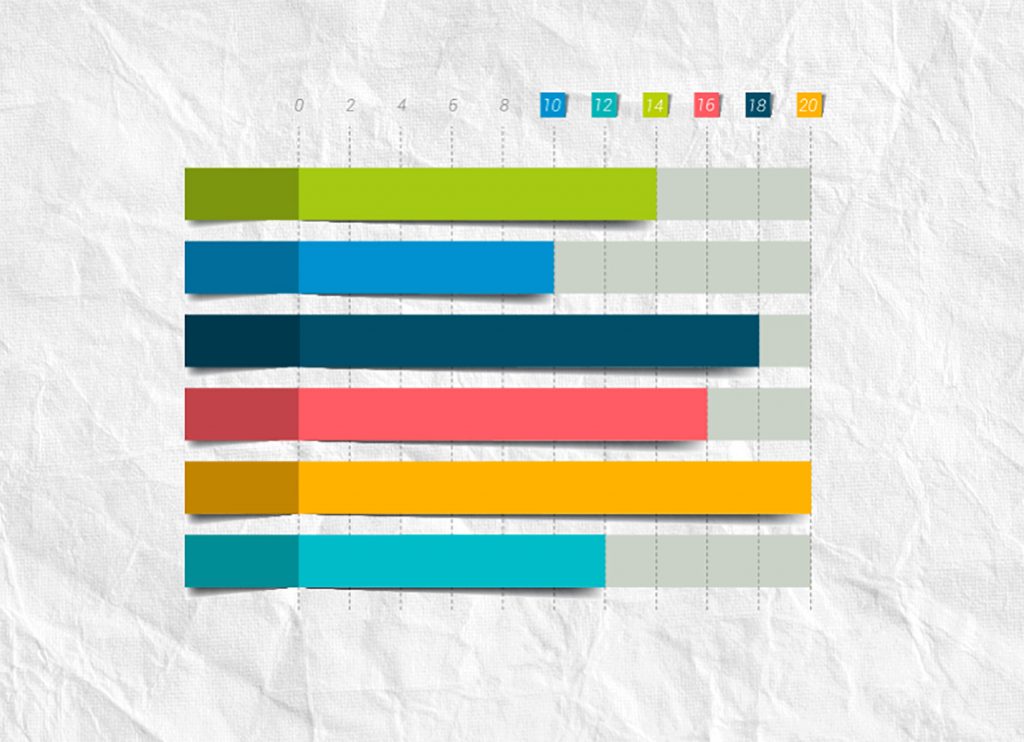

Once you have selected a type of figure that accurately represents the data, it is time to add information to make sure the figure is clear and easy to read.

Labels provide critical information on what is included in a figure.
This typically includes a title, labeled axes, and a key of any lines, bars, dots, or other data represented in the chart in which the meaning is not obvious.
Line, colors, textures, and patterns can distinguish between different forms of data.
It is important to minimize information that may distract from the data or lead to misconceptions.

Now, the data visualization needs to be engaging: capturing and holding the viewer’s attention so they will read and think about the figure.
This video presents the idea of making data visualizations engaging to a reader.

People will not look for information within data, or convert that information into knowledge and usable wisdom, unless the data is presented in an accurate, clear, and compelling manner.
Genetic technologies pose a significant challenge in education because much of the process is only indirectly observed. The rest of this guide will include a variety of visualizations about gene tech.
Genetic Technologies Overview

Genetic technologies far surpass artificial selection in the rate and degree of impact we can have on a species’ genetic information.
This video provides an overview of the basic techniques associated with altering the genetic make-up of an organism.

Even as genetic technologies advance, the same basic steps apply: cutting out the desired gene, making more copies inserting the gene into another chromosome, growing cells with the recombined chromosome, and confirming that the transferered gene is present.
This illustration of a-t-c-g is an iconic indicator of the base sequence of a chromosome. It is used in advertisements and movies to indicate genetic technologies.
Similarly, this image of a gel is iconic, and indicates how the a-t-c-g sequence was determined: by separating fragments of DNA on a gel.

Data visualization can start when you begin collecting the data itself. Field journals can include graph paper so figures can be sketched on location. Consider keeping a field journal for data in either digital or hard copy form.
You can see how the “junk journals” in this photo inspire data collection and visualization on this module’s resource page.
In the next section we will explore how traits may be impacted by more than the sequence of DNA.
Check your knowledge. Can you:
-
match different forms of visualization with the information that is being conveyed?
-
diagram the steps involved in cutting, copying, and moving pieces of DNA?
Go back to the Gene Tech Guide Overview

Go forward to the Epigenetics Page
Gene Tech Lecture Guide Contents
The material from this guide and corresponding lecture is assessed on the weekly quiz.


Back to Genomes
Module 8 Overview
This Guide
Gene Tech
