
Human Population Raising Carrying Capacity


Human Population Objectives
- Describe trends in the global human population, including life expectancy, infant mortality, fertility rate, overall growth, and regional differences.
- Explain how we (humans) have raised our carrying capacity and how this relates to current birth rates, death rates, and overall population growth.
- Match different forms of data visualization with the information that is being conveyed.
We have three modules left in this course. This video highlights where we are headed.
Human Population

Earlier in the term, we worked with this population size chart. What if a species could dramatically raise its own carrying capacity? What would happen to the size of that population?
We are living this experiment right now.
This video provides as overview of the current state, and future predictions, related to our population size. Make note of the trends in life expectancy, infant mortality, fertility rate, and growth.

We have raised our own species’ carrying capacity significantly over the past 150 years.

Green Revolution

Modern Medicine

Along with agricultural and medical advances, other key research and engineering advances have included portable sanitation, community water treatment, and education. Services vary significantly worldwide.

This population growth figure shows four different stages. In the first stage, annual birth rate and death rate are high and similar, so the population is a constant size. In the second stage, something drops the death rate like more food or better medicine. Since the annual birth rate now exceeds death rate, the population size is increasing. In the third stage, birth rate is declining. In humans this happens when more infants survive and families start having fewer children. The population is still increasing because birth rate still exceeds death rate. In the fourth stage, birth rate and death rate are the same again and the population stays a constant size.
Countries with more people at younger ages will grow in size in the future as these individuals enter their reproductive years. So there will be a large population increase in Nigeria, but not the United States. These population pyramids are important in planning what resources will be needed in the future and whether there will be enough young people in the workforce.

Data Visualizations

Data visualization is the use of graphs, plots, infographics, and other figures to visually represent data.
Data visualization starts with a choice: selecting the correct format to represent the data accurately.

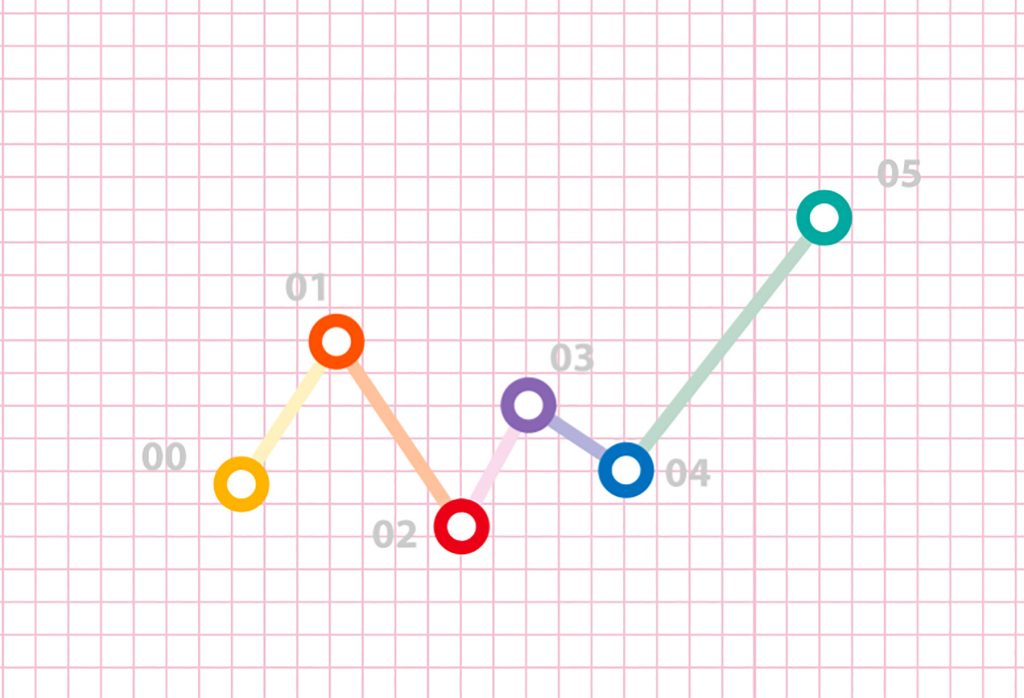
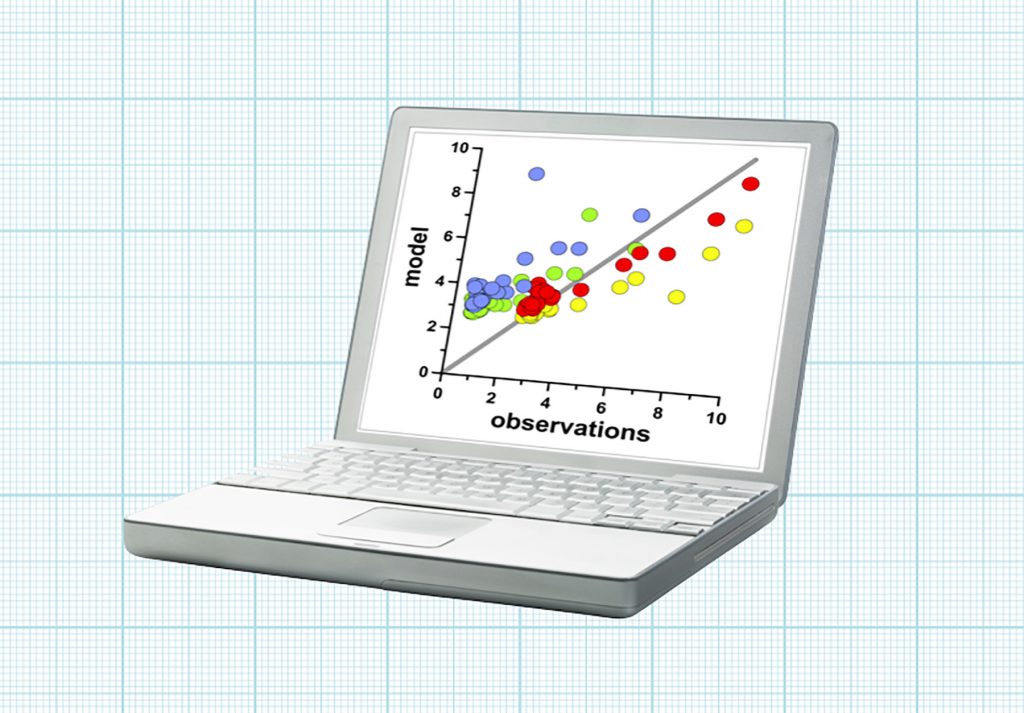
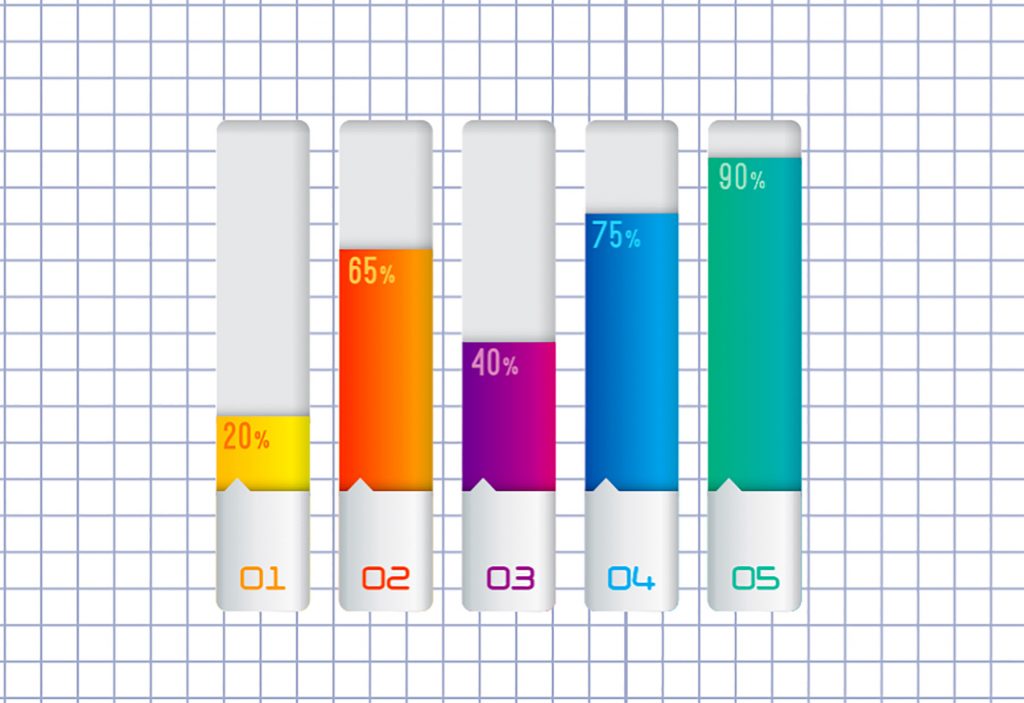
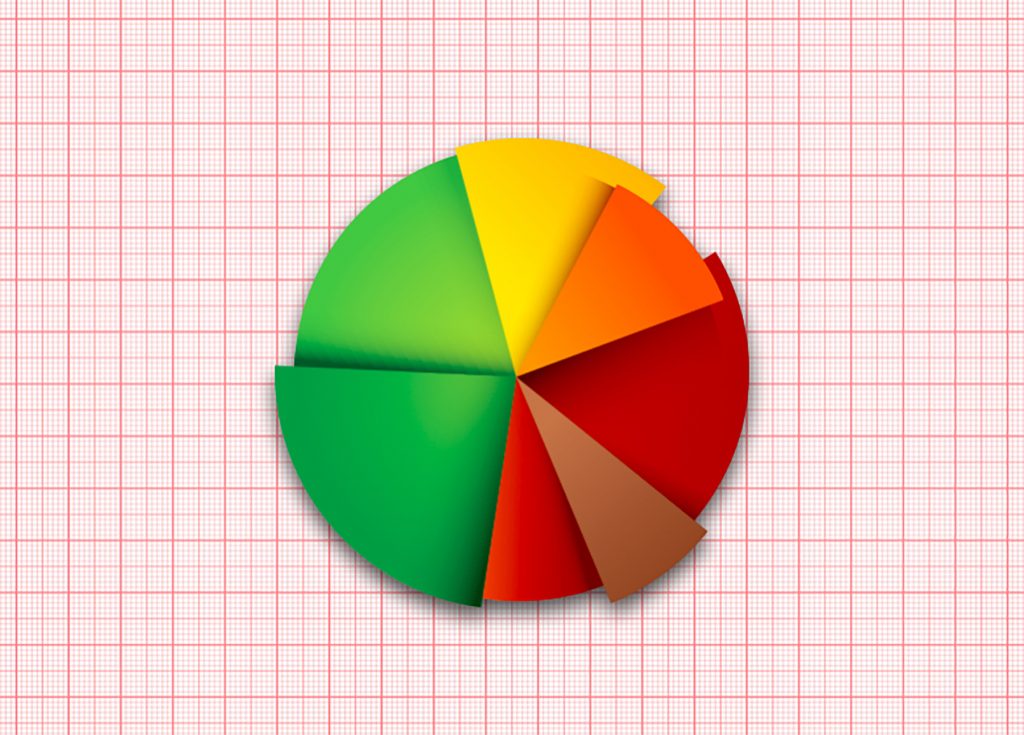
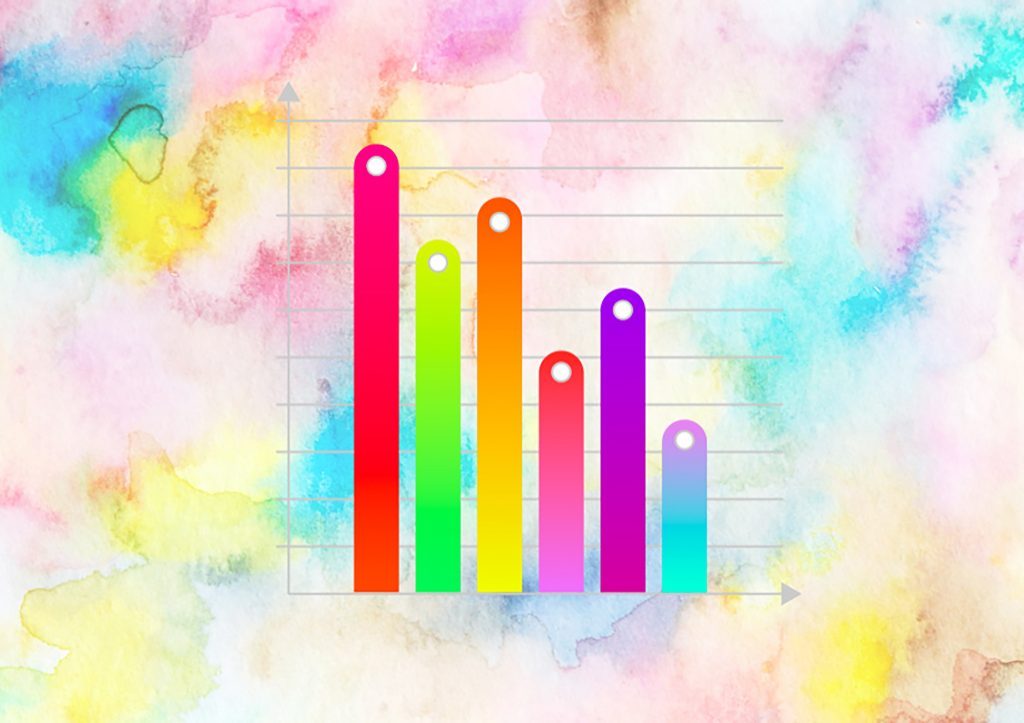
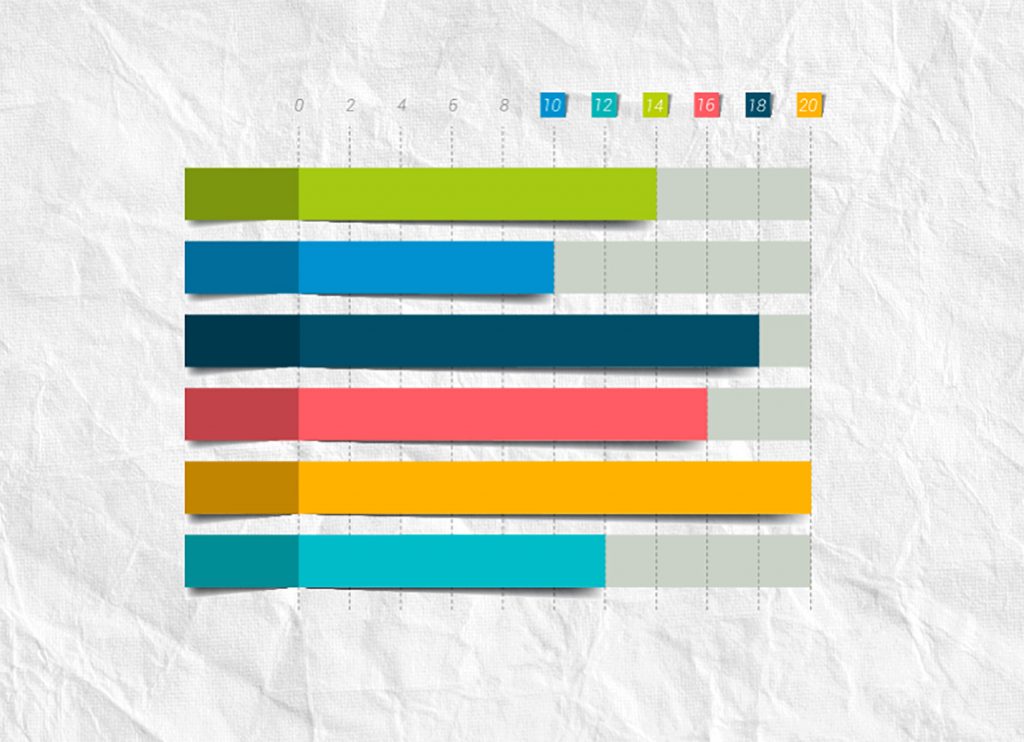
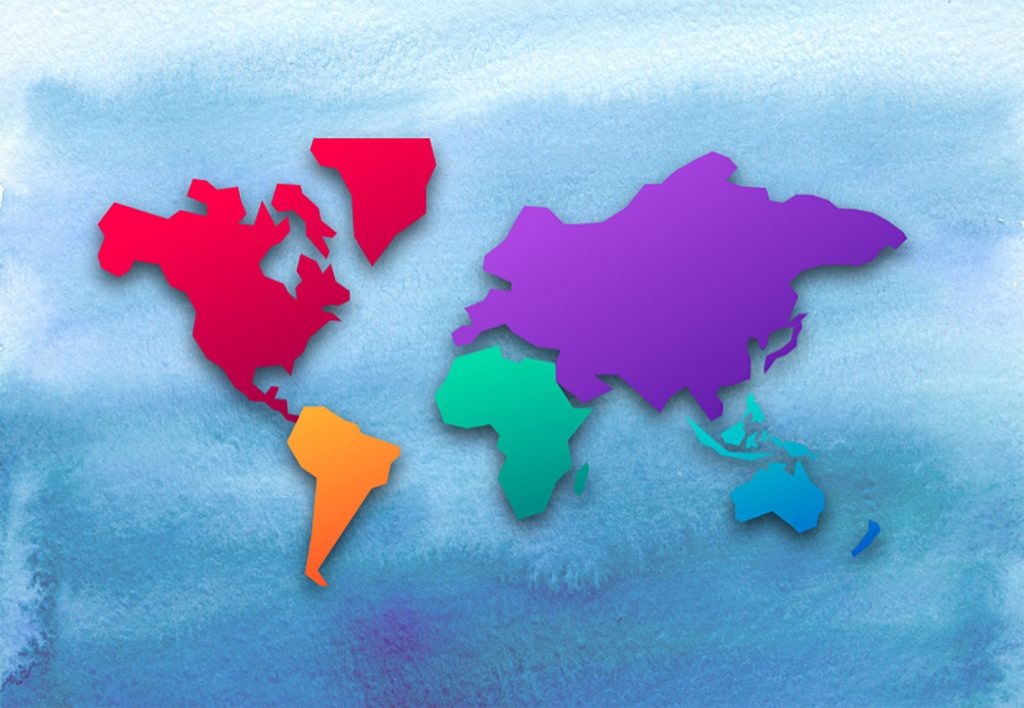
Advance through this slider to review eight common forms of data visualization, and what they represent.
Hover over the images to pause the scroll

Once you have selected a type of figure that accurately represents the data, it is time to add information to make sure the figure is clear and easy to read.

Labels provide critical information on what is included in a figure.
This typically includes a title, labeled axes, and a key of any lines, bars, dots, or other data represented in the chart in which the meaning is not obvious.
Line, colors, textures, and patterns can distinguish between different forms of data.
It is important to minimize information that may distract from the data or lead to misconceptions.

Now, the data visualization needs to be engaging: capturing and holding the viewer’s attention so they will read and think about the figure.
This video presents the idea of making data visualizations engaging to a reader.

People will not look for information within data, or convert that information into knowledge and usable wisdom, unless the data is presented in an accurate, clear, and compelling manner.
Start Your Media Assignment here
Data Visualization
For this media assignment, you are producing a data visualization. This could be your quadrat data, data you already have collected in the past, or new data you collect for this assignment. The data needs to be related to some type of natural phenomenon. For example, you could use weather data, the number of hours an animal is active, calories in a daily diet, the size of populations in different areas, etc.
Your data visualization needs to:
-
be in a figure format that you feel accurately represents the data. This could be a line chart, bar chart, scatterplot, pie chart, histogram, cartogram (map), or something less conventional.
-
clearly present the data with a title, labels, and/or key as needed.
-
have an engaging design that captures attention. This could be color, patterns, texture, 3D modeling, a witty shape, or whatever you create.


The next section introduces interactions between humans and the environment.
Check your knowledge. Can you:
- describe trends in the global human population, including life expectancy, infant mortality, fertility rate, overall growth, and regional differences?
- explain how we (humans) have raised our carrying capacity and how this relates to current birth rates, death rates, and overall population growth?
- match different forms of data visualization with the information that is being conveyed?
Go back to the Habitat Guide Overview

Go forward to the Human Ecology Page
Habitat Guide Contents
Complete all four of these sections before taking the quiz and making your media piece.


Back to Module 8
Impacts
This Guide
8A: Habitat
Products Information
8A: Quiz & Media
